Buy 1684, avoid 1687: An Historic German Vintage Chart
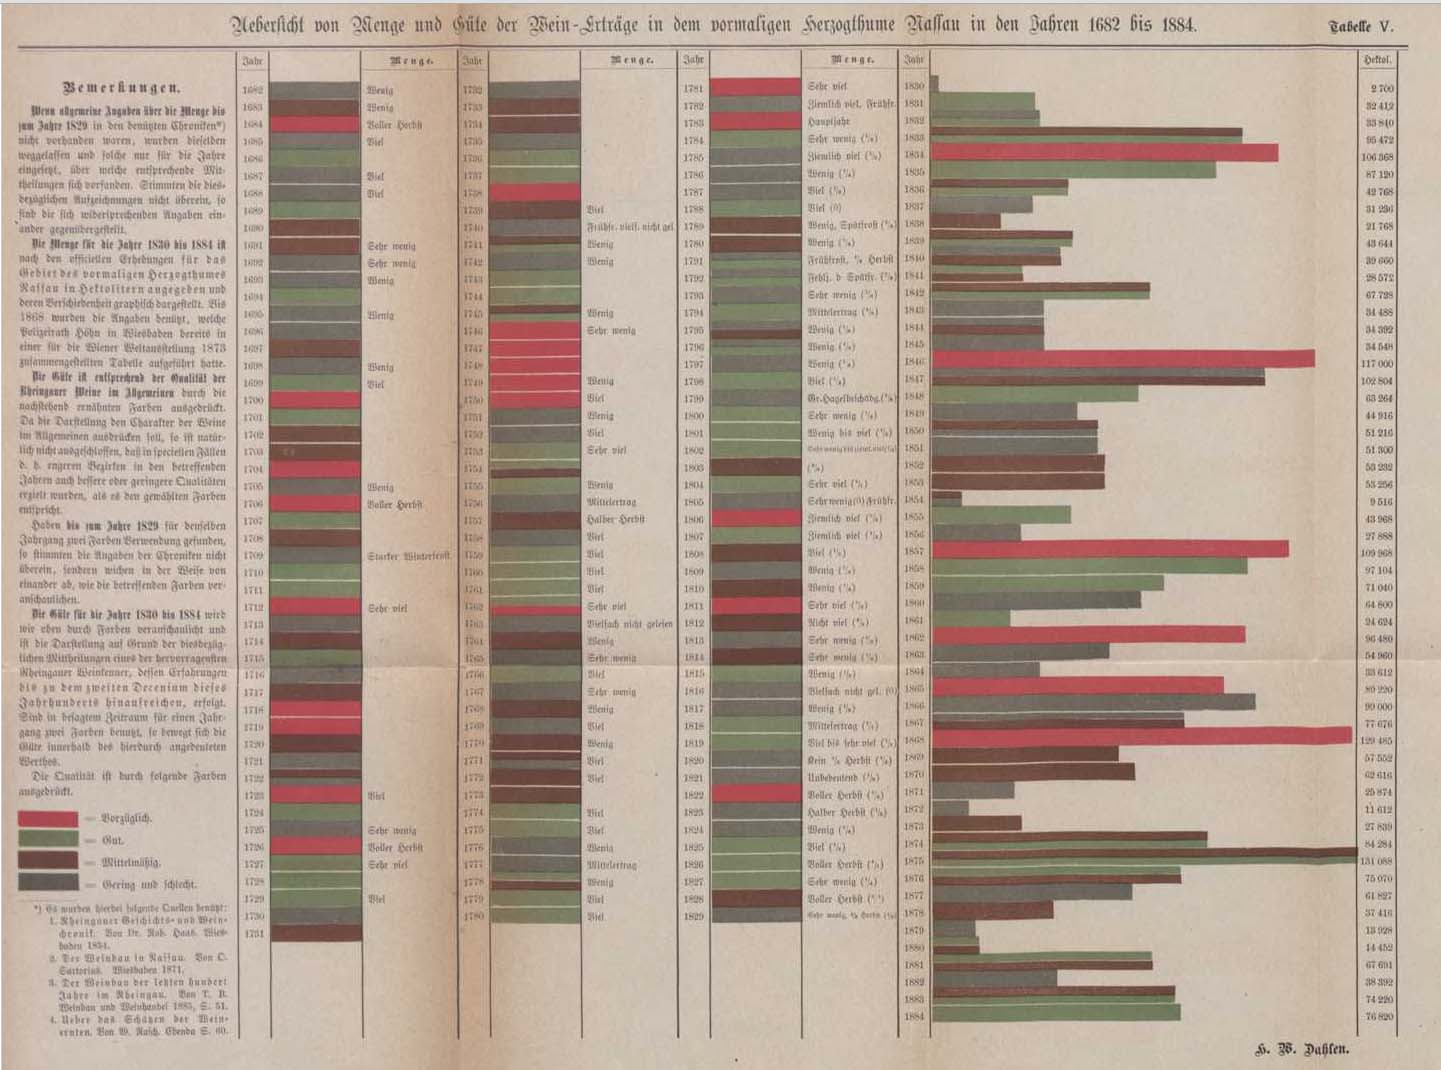
Uebersicht von Menge und Güte der Wein-Erträge in dem vormaligen Herzogthume Naussau in den Jahren 1682 bis 1884.
Some of you may recall that I have an interest in wine related tables which is reflected in such posts as A Visual History of Wine Gauging Tables. This interest led me to Heinrich Wilhelm Dahlen’s book Karte und Statistik des Weinbaues im Rheingau und sämmtlicher sonstigen Weinbau (1885) that is full of viticultural statistics for the Rheingau and other areas. Though these statistics caught my eye, it was the colorful vintage chart for the former Duchy of Nassau that stood out in the otherwise stark and dry book. The chart is fascinating for several reasons. First, it covers the vintages of 1682 through 1884. I do not yet know of any vintage chart that describes both quantity and quality of wine-yield for 17th century vintages. If you are aware of one then please let me know. Second, to describe quantity and quality it employs a color-coded bar chart where the color indicates the quality and the width of the bar indicates the quantity.
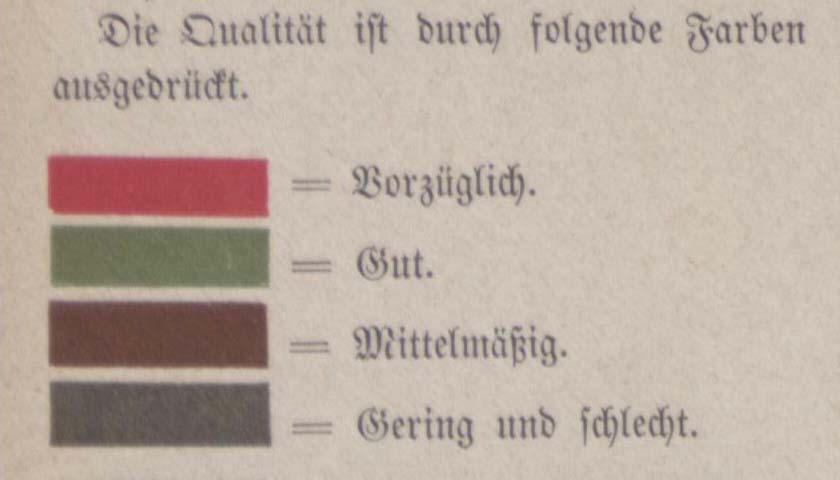
Die Qualität ist durch folgende Farben ausgedrückt.
The chart is assembled based on several sources of information. On inspection you will notice slight format changes but the overall idea is consistent. There are four quality levels indicated: vorzüglich (excellent), gut (good) , mittelmäßig (fair), and Gering und schlecht (poor and low). The quality levels are color coded: vorzüglich (red), gut (green), mittelmäßig (brown), and Gering und schlecht (gray). The quantity of the wine is indicated in two manners. For the years 1682-1829, specific quantities were not available so the bar widths are fixed. The quantities are verbally described using such terms as echt viel for a large quantity. For 1830 through 1884 specific quantities were available so the width of the bar directly correlated with the amount. Thus with a quick glance you can see that the vintages of 1834, 1846, and 1868 were both of the highest quality and produced in the largest quantity. After 1868 there was a string of poor vintages with that of 1875 surely flooding the market.

Five great vintages in a row!
Dahlen, Heinrich Wilhelm. Karte und Statistik des Weinbaues im Rheingau und sämmtlicher sonstigen Weinbau. 1885. dilibri Rheinland-Pfalz. URL: http://www.dilibri.de/rlb/content/titleinfo/94715
-
August 1, 2014 at 8:51 amOnline Posts and Articles on the History of Wine: #1 | Hogshead - A Wine Blog
